Eye on electricity
Was electricity demand higher in 2024?
- Consumers
In Aotearoa New Zealand the majority of electricity demand comes from residential, industrial and commercial consumers. In a previous Eye on Electricity article, the Electricity Authority Te Mana Hiko highlighted that electricity demand was higher in the first half of 2024 when compared to 2018-23. While reduced demand during Covid lockdowns may have played a role, the increase seen in the first half of 2024 was primarily due to:
- higher summer temperatures and cooler autumn temperatures driving up air conditioning and heating demand
- drier conditions increasing demand from irrigation for agriculture
- increasing electrification of transport, industrial processes and homes.
This follow-up article explores why several months in the second half of 2024 had lower than historic electricity demand. This change in trend was largely due to lower industrial demand, and some cooler months with higher than average temperatures.
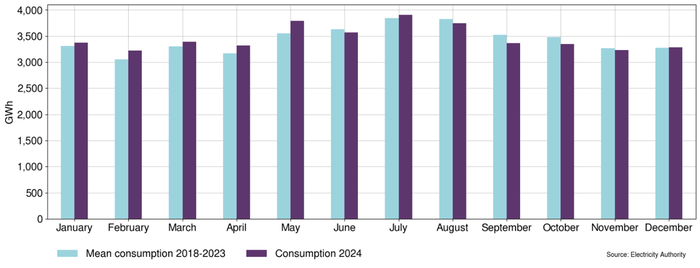
Now that all of 2024 can be analysed, the demand trend appears to change in the second half of the year (Figure 1). While 2024 demand was higher than 2018-23 demand in January-May, July and December, it was lower in June and August-November.
Industrial electricity demand decreased in 2024
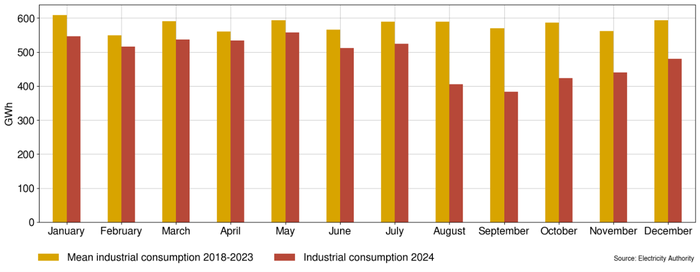
One reason for this apparent change in trend is a decrease in industrial demand (Figure 2). Most industrial demand in Aotearoa comes from the New Zealand Aluminium Smelter (Tiwai Point), the Glenbrook Steel Mill and various wood processors.
As Figure 2 shows, demand from major industrials was lower for all of 2024, partially due to the closure of Norske Skog’s Tasman paper mill in 2021. However, industrial demand decreased significantly in August and had not fully recovered by December 2024.
Most of this decrease was due to the demand response agreement between the New Zealand Aluminium Smelter (Tiwai Point), Meridian Energy and Contact Energy. Meridian initially called on this agreement on 22 June due to low hydro storage. Meridian increased the required demand response in August, with Tiwai Point agreeing to a 205MW reduction (20MW higher than the contracted maximum) from 23 August. The agreement ended on September 30, and Tiwai Point will be slowly building back up to their full demand until April 2025.
Other industrials, such as Pan Pac Forest Productions, also reduced operation in August to minimise their exposure to the high wholesale electricity prices in August. However, the Authority found that risk management options were available prior to the high electricity prices. In the second half of 2024 multiple wood processors announced they would be closing.
Non-industrial electricity demand was higher in 2024
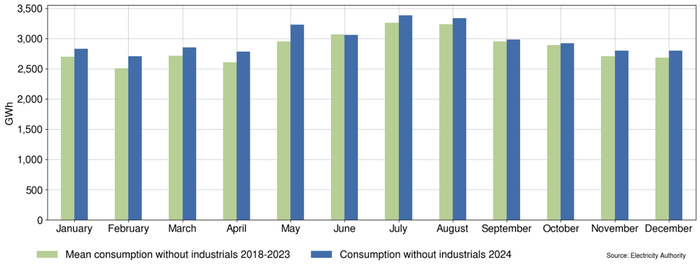
To look at the trends in non-industrial demand, Figure 3 shows the total national demand (Figure 1) without the major industrial demand (Figure 2). It demonstrates that non-industrial demand was higher in 2024 than in 2018-23 for every month except June.
Warmer temperatures decreased heating in winter and increased cooling in summer
As discussed in the previous 2024 demand article, low temperatures in winter and high temperatures in summer increase electricity demand for heating and cooling. The winter of 2024 was the third warmest on record, with the first and second warmest taking place in 2022 and 2021, respectively. On average, June 2024 was 1.1°C warmer than the 1991-2020 average, July 0.9°C warmer and August 1.0°C warmer.
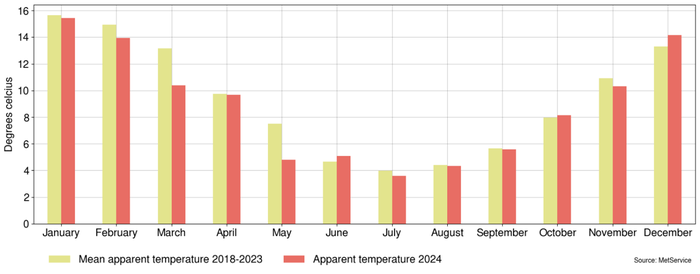
While all winter 2024 months were warmer than average, only June felt1 warmer in 2024 than in 2018-23 (Figure 4), and it is feeling cold that makes people turn on their heaters.
November and December 2024 have also been warm, with November temperatures above average or well above average for most of the country, and December 2024 being the 5th warmest on record. However, of those months, only December felt warmer on average (Figure 4). While warmer winters reduce demand, warmer summer temperatures increase demand for cooling.
Electricity demand for irrigation use was high – excluding the wet spring period
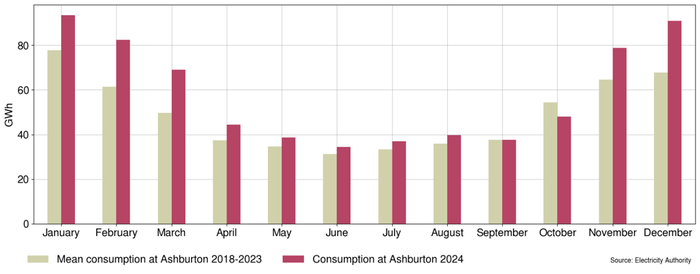
Irrigation for agriculture also consumes a lot of electricity in Aotearoa, primarily between September and April. The Canterbury region irrigates the most land, but irrigation takes place all over the nation. The Ashburton node is a good indicator of irrigation demand in Canterbury (Figure 5). At the beginning of 2024, dry conditions drove up irrigation demand.
In September 2024, above normal rainfall in the lower half of the South Island likely reduced irrigation demand in those regions. Similarly, October was the wettest on record for 10 South Island locations.
In contrast, November was dry for much of the country, driving up irrigation demand. December was also dry for southern Canterbury and North Otago.
Increasing electrification and new technology is increasing electricity demand
Another driver of increasing demand is the ongoing electrification of homes, transport and businesses. For example, every recent year including 2024 saw increases in electric cars, heat pumps, and electric water heaters.
The growing popularity of artificial intelligence and other complex computation also drives up electricity demand. In 2023, data centres consumed approximately 1-1.3% of electricity globally. In January 2025, Aotearoa has 53 data centres listed in use or under construction and this number is likely to continue increasing.
Despite lower electricity demand in the second half of 2024, demand is still likely to increase
In summary, electricity demand in 2024 increased in earlier months and decreased in later months when compared to 2018-23. Most demand decreases were due to lower industrial demand. Tiwai Point demand will fully return in April next year, but some wood processors have permanently closed. If industrial load is removed, demand has increased in 2024 for every month except June, which felt warmer than the other winter months. Continued electrification and technological advances contributed to this increase.
Looking forward, it is likely that demand in Aotearoa will grow as the population increases, electrification continues, and more datacentres are built. Increasing temperatures due to climate change may also increase summer cooling demand. However, the electricity industry is already responding with the potential for 38GW of new generation compared to the current 11GW. The Authority will continue to review and monitor electricity demand and new generation to support Aotearoa New Zealand in its growth.
1. Due to other factors such as wind speed and humidity, the temperature being warmer may not mean that the weather feels warmer. An apparent temperature is calculated to approximate how hot the weather feels.
Related News
Electricity Authority launches free power comparison and switching site ‘Billy’
New Zealanders can now compare and switch power plans with confidence using Billy, the new, free, publicly-owned comparison and switching site launched today b…
Consultation opens on how retailers will provide consistent information about their power plans
The Electricity Authority Te Mana Hiko has opened consultation on a proposed format for the prescribed Electricity Information Exchange Protocol 14A – Re…
New rules for power companies to improve bills, reduce bill shock and introduce product information standards
The Electricity Authority Te Mana Hiko has announced new rules to protect consumers by improving electricity bills, preventing large back bills and requiring p…